.svg)

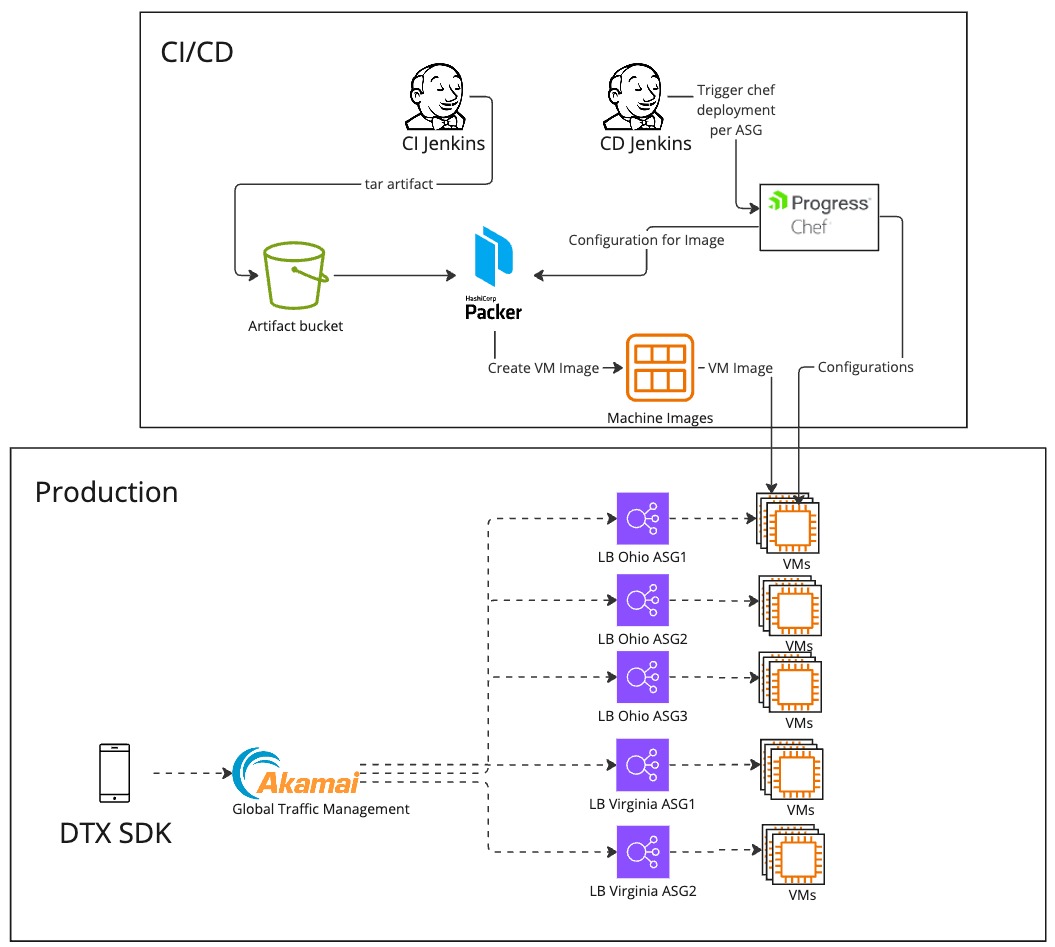
For years, DT Exchange relied on Amazon Web Services (AWS) with EC2 instances. But once we encountered a massive surge in demand, hitting two million requests per second, we had to scale up to 6,000 EC2 instances. However, this success came with challenges. We had to navigate complexities like managing traffic across multiple ELBs using Akamai GTM for traffic management and automating configurations using Chef. It wasn't an easy journey, but we overcame these obstacles.
Transitioning from Our Old Environment to Kubernetes and Dockerization
We made the strategic decision to transition to Kubernetes and Dockerize our system. This shift offered several compelling advantages over our previous architecture. Firstly, Kubernetes simplified infrastructure management, allowing us to focus more on development and less on maintenance tasks. Secondly, Dockerization streamlined our deployment process, making it more efficient and cost-effective In addressing this challenge, we implemented a comprehensive pipeline encompassing preparation and deployment. While this strategy initially appeared promising in resolving the issue, we encountered additional problems at scale.
So what is the solution? Well, this is what we want to talk about today!
Preparations and Dockerization
Transitioning from Multi-Repo to Monorepo
Our project is a multi-module project, using Maven as the build tool and written in Java 8 and Scala 2.11.8. Initially it consisted of multiple repositories, each containing different components and dependencies. Among these was our crucial "setup" module, responsible for configuring our environment for local testing and system runs. However, relying on external repositories for essential dependencies posed challenges, leading us to migrate to a unified monorepo structure. A significant challenge we faced was the rigid dependency on a static path ("/mnt/...") for accessing system and integration configurations. This approach lacked flexibility across different operating systems, limiting our adaptability.
To address this, we embarked on a refactoring journey, reconfiguring our codebase to accommodate various paths enhancing our control over configurations, and transitioning into a monorepo approach. This transition to a monorepo structure not only consolidated our codebase but also streamlined our build processes and improved operational efficiency. By centralizing our project components and dependencies, we established a more cohesive and manageable development environment.
Embracing Dynamic Configurations with Helm
In addition to restructuring our repository, we revamped our approach to managing configurations, particularly those previously handled by Chef. These configurations played a pivotal role in system setup, encompassing crucial settings essential for image deployment. One notable challenge was the dynamic nature of certain configurations, such as MaxMind and WURFL files, which underwent frequent updates. Previously managed by Chef, these files required intricate procedures for downloading and incorporating them into our image deployment process.
To streamline this process and ensure seamless integration of dynamic configurations, we transitioned to leveraging Helm. Helm provided us with a more robust and efficient mechanism for managing configurations within our deployment pipeline. By encapsulating configuration settings into reusable Helm charts, we facilitated consistent and automated deployments across our environments. Embracing Helm not only simplified our configuration management process but also enhanced our ability to deploy applications with the latest and most up-to-date configurations.
Deployment Management
As we replaced Chef with Helm for the configuration management, using the helm charts for Kubernetes resources and Helm parameters for environment-specific settings. Luckily, concurrently, new EKS clusters were deployed using ArgoCD to manage deployments simplifying the CD process and reducing it to a simple Jenkins job that updates the Docker image tag in the ArgoCD repository. By utilizing ArgoCD sync policy (in other words, disabling the auto sync) we achieved SOX compliance for our production deployments.

Problems at Scale
Although significant progress was made in resolving these issues, we did encounter additional challenges along the way. Pods were failing at scale, there were memory issues when facing realistic traffic, and on top of those, there were also networking issues.
Launching Pods and the Unforeseen Obstacles
After load testing with Locust (to fire requests in high volumes), everything looked very promising. But the moment we exposed the cluster to only 0.1% of the traffic—the pods crashed.
Our monolith has “monolith-style logs” with different aspects of the application being logged in different log files. That means we’d need to kubectl exec into a pod and see what’s going on. To do so, we’ve disabled the liveness probe entirely.Kubernetes uses liveness probes to determine whether a pod is “alive” which means the main process of the pod can stay running. If the liveness probe is failing (after a configured threshold) the main process (PID 1) is terminated first with a SIGTERM and then—once a certain configured grace period expires—with a SIGKILL to forcefully terminate the process and the pod with it.
Disabling the liveness probe left us only with a readiness probe which determines whether the pod is receiving traffic. With only the readiness probe working, we prevent pod restarts, thus granting us visibility into the failing pods and their logs. We can kubectl exec into a pod and start debugging:
$ kubectl exec -it -n namespace -c container pod_name -- sh

# curl localhost:8080/healthcheck
curl: (7) Failed to connect to localhost port 8080 after 0 ms: Couldn't connect to server
Strange… so we took a look at the Garbage Collection log:
# tail -f /mnt/InnerActive/Logs/gc.log
What we saw was full GC all the way:
241.656: [GC (Allocation Failure) [PSYoungGen: 3545255K->89493K(3593728K)] 10999975K->7547901K(11103232K), 0.0329322 secs] [Times: user=0.36 sys=0.00, real=0.04 secs]
1244.398: [Full GC (Ergonomics) [PSYoungGen: 104954K->0K(3595264K)] [ParOldGen: 7499013K->6879594K(7509504K)] 7603967K->6879594K(11104768K), [Metaspace: 170839K->170839K(1202176K)], 3.2441852 secs] [Times: user=39.71 sys=0.08, real=3.24 secs]
1247.162: [Full GC (Ergonomics) [PSYoungGen: 97342K->0K(3633152K)] [ParOldGen: 7503856K->6938501K(7509504K)] 7601199K->6938501K(11142656K), [Metaspace: 171663K->171663K(1204224K)], 3.0029931 secs] [Times: user=36.13 sys=0.08, real=3.00 secs]This means that the application got so busy with garbage collection that it couldn’t handle new connections at all.
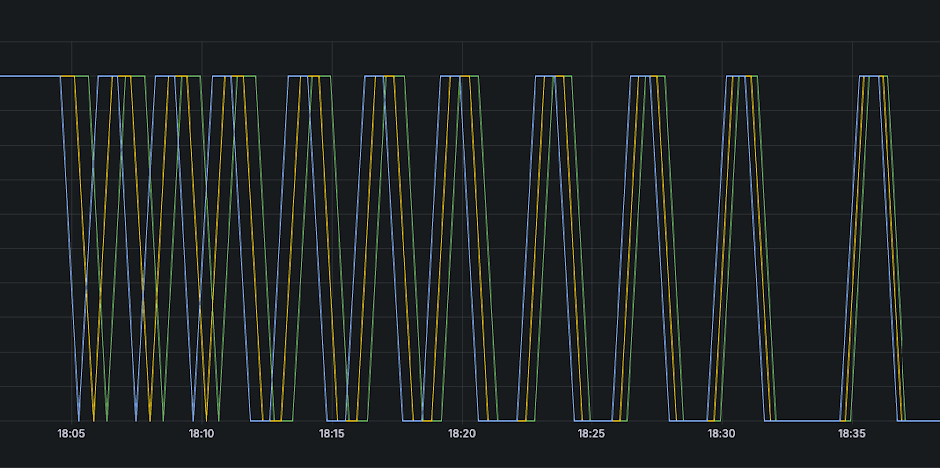
Next, we looked at the nice JVM metrics we received from Jolokia:

We’re getting within ~10% of the maximum memory too fast, and the GC doesn’t seem to handle the pressure, and we get locked down in GC cycles.
But it worked fine on the EC2 instances and the load test went very well. What happened?
Load Testing Should Use Real Replicated Traffic
The load test was wrong. Sending the same request means that the majority of the flow is repeating with the same patterns which can lead to aggressive optimizations by the HotSpot JIT compiler (there’s a lot to say about it, but maybe in another article).
So when facing real traffic, everything broke down.
Kubernetes Pods Play by Different Rules
On EC2, we didn’t care much about the xmxvalue and the JVM memory could expand all the way up to the physical maximum of the instance. In Kubernetes, we put an explicit limit on memory. Because there’s an inherent overhead (like the kubelet, the node-exporter, and other daemonSets) that doesn’t exist in simple EC2 instances, that limit was lower than the utilization in EC2 allowed.
Finally Change to G1GC
It was time to modernize. Our elderly Java 8 monolith needed to finally move away from CMS into G1GC (in another article, we might tell the story of how we moved from Java 8, Scala 2.11 to Java 17 with Scala 2.13 and the pitfalls we’ve faced).
Resize
Now the cluster was stable, but still not as efficient as the EC2 instances. To reduce the overhead Kubernetes infrastructure, we decided to use our monolithic application’s greatest advantage, together with the new GC: the ability to scale vertically. So we doubled the node sizes and the requested resources for our application. Because G1GC doesn’t have as many stop-the-world full GC cycles as CMS GC, we can now manage a larger heap. This resizing reduced the impact of the overhead introduced by K8s by quite a lot, with the bonus of getting slightly cheaper spot instances (on average).

Increase Connection Queue
Soon after we fixed the failing pods issue and started migrating more real traffic to the new cluster, we hit another wall: ~80% of the requests got the 503 HTTP status code (service unavailable).
After some investigation, we looked at the TcpExtListenOverflows metric (generated for us by the Telegraf Operator) and noticed it’s not zero.
Why is that a problem?
This metric measures the amount of TCP packets that were dropped from the accept queue, which means that we were dropping packets and returning a failed request to the client.
Shortly, we identified the root cause, which turned out to be related to somaxcon, (specifically net.core.somaxconn) is a parameter within the Linux kernel that determines the maximum number of connections that can be queued for a socket.
Given the substantial volume of requests each EC2 instance needed to manage, we found it necessary to increase this parameter.
Glad we have found the problem, we went on and increased the somaxconn value only to find out it’s not so simple in K8s. Apparently, Kubernetes considers somaxconn an unsafe sysctl class, which means K8s will block the scheduling of any pod that tries to update it. To bypass this restriction two things were needed:
1. Adding a parameter to the kubelet of the node:
allowed-unsafe-sysctls 'net.core.somaxconn'
2. Adding securityContext to the pod manifest:
apiVersion: v1
kind: Pod
metadata:
	name: sysctl-example
spec:
    securityContext:
    	sysctls:
        - name: net.core.somaxconn
          value: "16384"
- Deploying a PSP (Pod Security Policy) allowing the unsafe sysctl:
apiVersion: policy/v1beta1
kind: PodSecurityPolicy
metadata:
   name: privileged
spec:
allowedUnsafeSysctls: net.core.somaxconnWe could see the effect both in the 5xx response codes reduction and the drop of TcpExtListenOverflows to 0.

Conclusions
This journey highlights the importance of adaptability in cloud infrastructure management.
Our journey through the outbreak of high demand and complex infrastructure challenges led us to a transformative solution: transitioning to Docker and migrating to Kubernetes.
While this strategic shift promised efficiency gains and simplified management, it also unveiled unforeseen obstacles at scale which we had to address.


.webp)
.jpg)
